
Understanding the Admin Dashboard
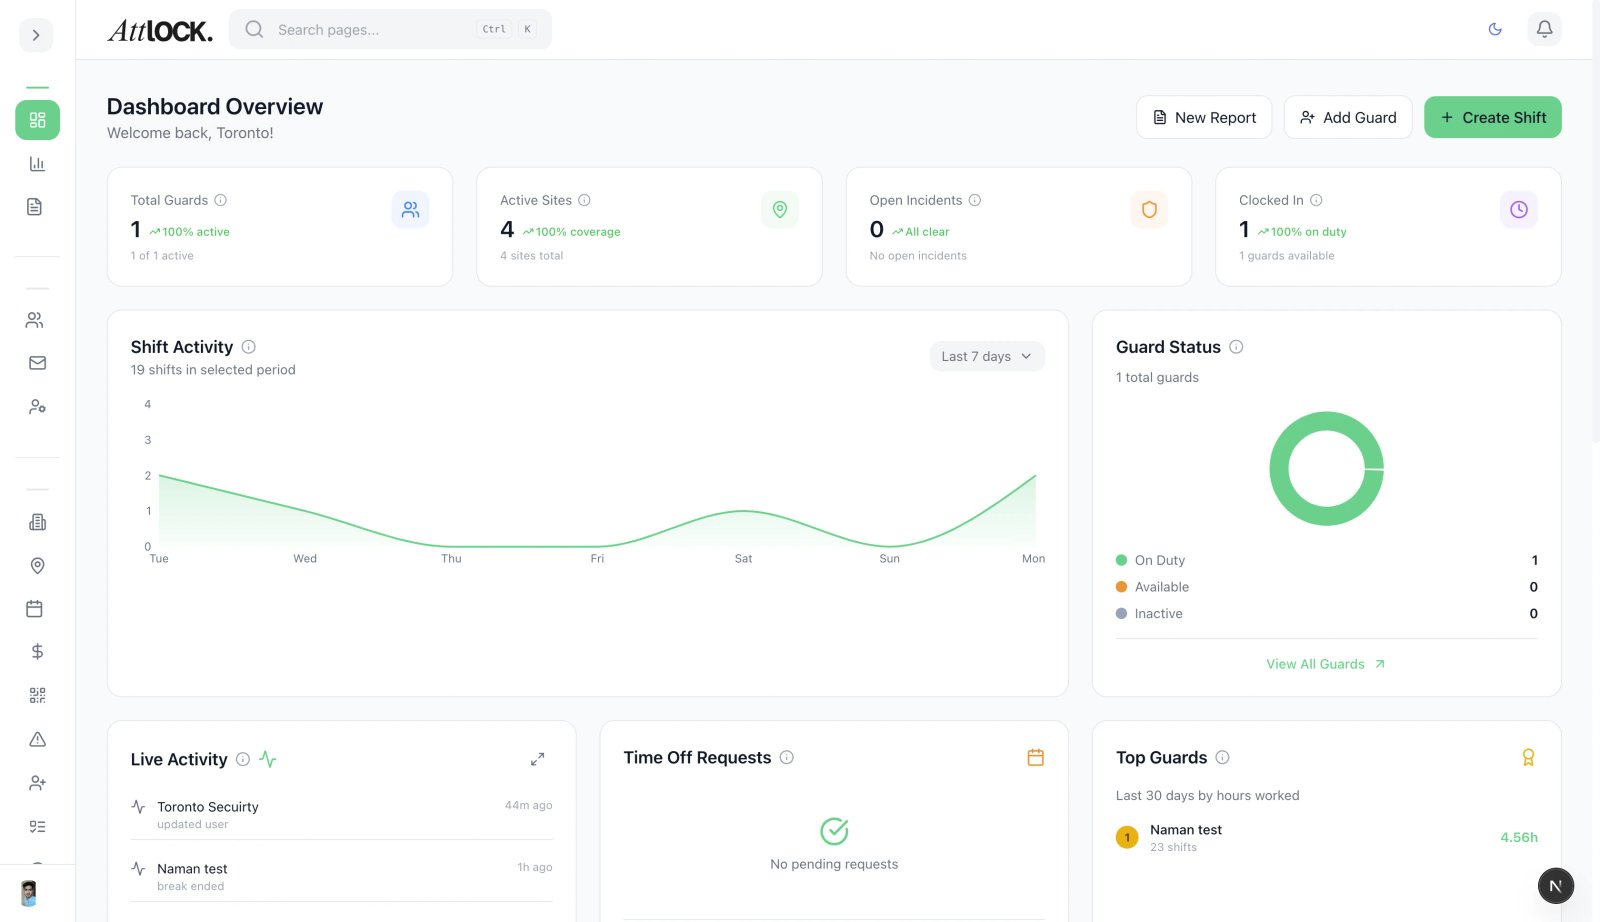
The Atlock admin dashboard is your central operations hub for managing every aspect of your security business. From here you can monitor guard activity, review incidents, manage schedules, and access every feature the platform offers.
Accessing the Dashboard
- Sign in at app.attlock.com with your admin credentials.
- You will land on the main dashboard at `/admin`.
- If this is your first login, you may see the Onboarding Wizard — complete it to configure your company basics.
Dashboard Layout
Top Bar
- Command Palette — Press `Ctrl+K` (Windows) / `Cmd+K` (Mac) to open a global search across all pages, guards, sites, and settings.
- Notification Bell — Shows unread alerts including panic alarms, geofence breaches, and system notifications.
- Profile Menu — Access your profile settings, switch themes, or sign out.
Panic Alert Banner
When a guard triggers an SOS/panic alert, a red banner appears at the top of the dashboard with details and quick-action buttons. This is the highest priority alert and cannot be dismissed until addressed.
Primary Stats Cards
Four key metrics displayed at the top:
- Total Guards — Total number of guards in your company.
- Active Sites — Number of sites currently marked as active.
- Open Incidents — Number of unresolved incident reports.
- Clocked In — Guards currently on duty.
Time Period Selector
Above the charts, select the time range for dashboard data:
- Last 7 days
- Last 15 days
- Last month
- Last 2 months
- Last year
- Last 5 years
Dashboard Charts & Widgets
Guard Status Pie Chart A pie chart breaking down your guard workforce:
- On Duty (green)
- Available (blue)
- Inactive (gray)
Weekly Shift Counts A bar chart showing shift volume day by day for the current week.
Incident Statistics Breakdown of incidents by severity:
- Critical (red)
- High (orange)
- Medium (blue)
- Low (green)
Weekly Hours Chart Payroll-focused chart showing total hours worked per day.
Activity Tabs
The lower section of the dashboard has tabs to view different activity feeds:
- Shifts — Upcoming shifts (7-day view).
- Incidents — Recent incident reports.
- Guards — Guard activity and status updates.
- Sites — Site-level events.
- Reports — Latest filed reports.
- Pass-on — Shift passdown entries.
- Time-off — Pending time-off requests.
- Compliance — Expiring certifications and compliance items.
Sidebar Navigation
The left sidebar organizes all features into 8 expandable sections:
- Overview — Dashboard, Analytics, Reports
- Team — Guards, Invitations, Access Control, Wellness
- Operations — Command Center, Clients, Sites, Zones & Regions, Scheduling, Payroll, Patrols, Lone Worker
- Field Management — Live Tracking, Operations Center, Alert Center, Incidents, Investigations, Tasks, Post Orders, Pass-on Logs, Notifications, Messages
- Facility & Fleet — Visitor Manager, Vehicle Manager, Parking, Vendors
- Assets — Equipment
- Compliance — Compliance hub, Policies, Checklists, Training
- Settings — Data Migration, Audit Log, API Settings, About
Sidebar controls:
- Press `Ctrl+B` / `Cmd+B` to toggle the sidebar.
- On mobile devices, the sidebar becomes a slide-out sheet.
- Your expansion state is saved in the browser.
Keyboard Shortcuts
| Shortcut | Action | ---------- | -------- | `Ctrl/Cmd + K` | Open Command Palette | `Ctrl/Cmd + B` | Toggle sidebar | `G` then `D` | Go to Dashboard | `G` then `A` | Go to Analytics | `G` then `R` | Go to Reports | `G` then `G` | Go to Guards | `G` then `S` | Go to Sites | `G` then `C` | Go to Scheduling | `G` then `I` | Go to Incidents | `G` then `M` | Go to Command Center | `G` then `N` | Go to Invitations |
|---|
Permission-Based Views
What you see depends on your role:
- Company Admin — Full access to all sections.
- Supervisor — Operational features, limited settings.
- Guard — Redirected to the guard portal (not admin dashboard).
- Custom Roles — Feature visibility matches assigned permissions.
Missing menu items usually mean your role lacks the required permission. Ask your Company Admin to check in Access Control.
Feature Gates & Subscription
Some features require specific subscription tiers (e.g., `commandcenter`, `vehiclemanager`, `trainingmodule`, `whitelabel`). Features behind a gate show a lock icon or "Upgrade" badge.
Dark Mode
- Click your profile avatar in the top-right.
- Select Theme and choose Light, Dark, or System.
Troubleshooting
Dashboard loads slowly
- Check your internet connection.
- Clear browser cache and try again.
- Supported browsers: Chrome, Firefox, Safari, Edge.
Stats show zero or unexpected values
- Check the time period selector — you may be viewing a narrow range.
- New accounts will show zeros until guards begin operations.
Panic banner won't dismiss
- Panic alerts require acknowledgement and action. They cannot be dismissed without resolution.
Related Articles
- Configuring Company Settings
- Understanding Roles and Permissions
- Using the Analytics Dashboard
- Creating a New Shift