


Using the Analytics Dashboard
The Analytics dashboard gives you a bird's-eye view of your security operations with charts, trends, and key performance indicators.
Accessing Analytics
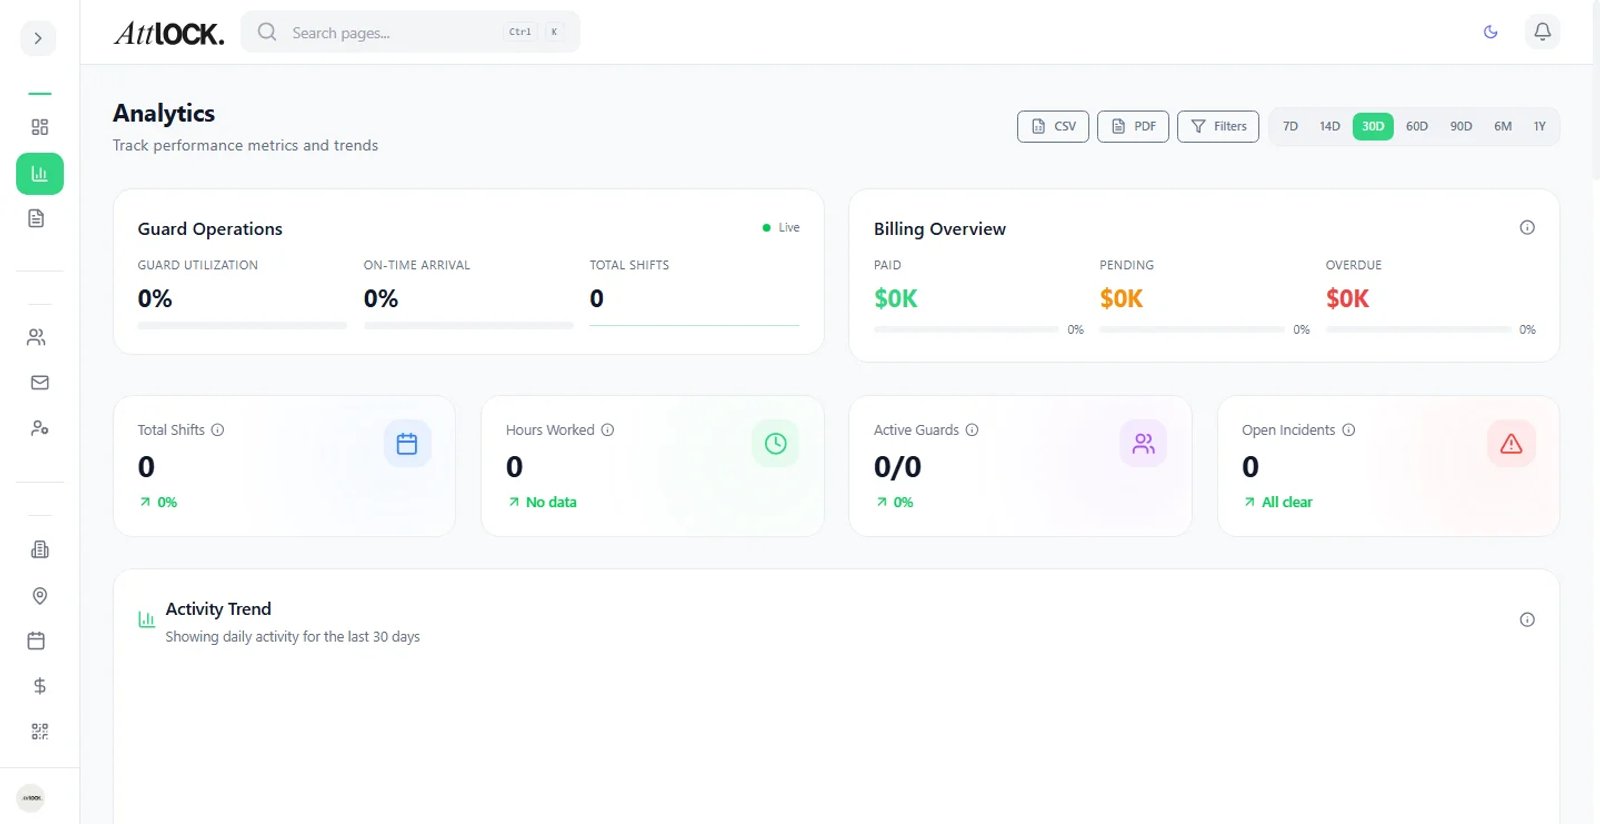
- Navigate to Overview > Analytics in the sidebar (shortcut: `G` then `A`).
- The main analytics page loads with default date range (last 30 days).
Dashboard Overview
The analytics page is divided into several sections:
Key Metrics Cards
At the top of the page, you'll find quick-glance metrics:
- Total Shifts — Number of shifts in the selected period.
- Hours Worked — Total guard hours logged.
- Incidents Filed — Number of incident reports.
- Average Response Time — Mean time to respond to alerts.
- Guard Utilization — Percentage of scheduled hours vs. capacity.
- On-Time Rate — Percentage of guards who clocked in on time.
Performance Charts
- Shifts Over Time — Line/bar chart showing shift volume trends.
- Incidents by Type — Pie or bar chart breaking down incident categories.
- Guard Attendance — Track clock-in patterns and attendance rates.
- Site Activity Heatmap — Visual representation of activity levels across sites.
Filtering Data
Use the filter bar at the top of the analytics page:
Date Range
- Click the date picker to select a custom range.
- Quick presets: Today, Last 7 Days, Last 30 Days, Last Quarter, Year to Date.
By Site
- Select one or more sites to filter all metrics to those locations.
- Use "All Sites" for company-wide data.
By Guard
- Filter to specific guards for individual performance analysis.
- Useful for performance reviews and identifying top performers.
By Shift Type
- Filter by day shift, night shift, or specific shift templates.
Guard Performance Metrics
Drill into individual guard performance:
- Click on a guard's name in any chart or use the guard filter.
- View their personal metrics:
- Attendance Rate — How often they show up on time.
- Patrol Completion — Percentage of assigned patrol checkpoints completed.
- Report Quality — Average detail score on filed reports.
- Incident Response — Average time to respond to alerts.
- Hours Logged — Total hours worked in the period.
Site-Level Analytics
Compare performance across sites:
- Navigate to Overview > Reports > Site Comparison.
- Select two or more sites.
- Compare metrics side by side:
- Guard hours
- Incident volume
- Patrol completion rates
- Response times
Exporting Data
Export to CSV
- Apply your desired filters.
- Click the Export button (download icon).
- Select CSV format.
- The file will download with all visible data.
Export to PDF
- Apply your desired filters.
- Click Export > PDF.
- A formatted report is generated with charts and tables.
- This is useful for sharing with clients or management.
Setting Up Automated Reports
You can schedule analytics reports to be sent automatically:
- Go to Overview > Reports > Automated Reports.
- Click Create Automated Report.
- Configure:
- Report Type — Select which analytics to include.
- Frequency — Daily, Weekly, or Monthly.
- Recipients — Enter email addresses.
- Format — PDF or CSV.
- Filters — Pre-set site, date range, and other filters.
- Click Save — reports will be sent automatically on schedule.
Tips & Best Practices
- Check analytics weekly to spot trends before they become problems.
- Compare periods — Use the date range filter to compare this month vs. last month.
- Share with clients — Export PDF reports for your security clients as part of your service delivery.
- Set up automated reports for recurring stakeholder updates.
- Focus on leading indicators — Attendance rate and patrol completion predict incident outcomes.
Troubleshooting
Charts show no data
- Verify the date range includes periods with activity.
- Check that your site/guard filters aren't too restrictive.
- New accounts will have limited data until guards begin operations.
Export is empty or incomplete
- Ensure the applied filters match your expectations.
- Very large exports may take a moment to generate.
Data seems delayed
- Analytics data is near real-time but may have a short processing delay (1-2 minutes).
- Refresh the page to get the latest data.
Related Articles
- Building Custom Reports with Report Builder
- Using Report Templates
- Setting Up Automated Report Delivery
- Sharing Reports with Clients