


Viewing Analytics and Performance Metrics
The analytics dashboard provides data-driven insights into the security performance at your sites. Use these metrics to evaluate guard effectiveness, identify trends, and have informed discussions with your security provider.
Accessing Analytics
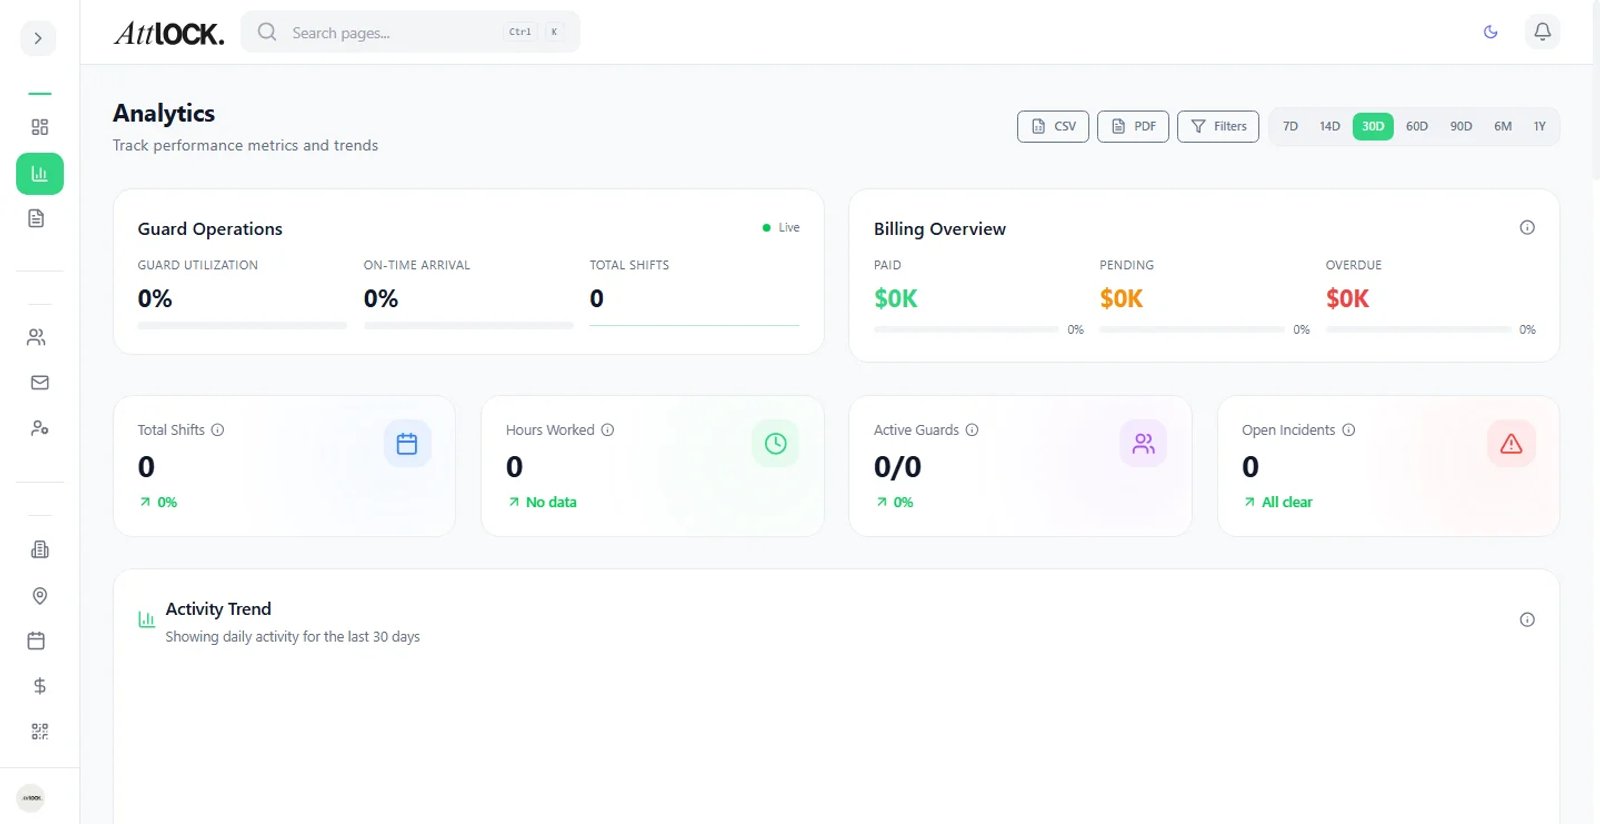
- From the Profile menu, tap "Analytics".
- The analytics screen loads with the subtitle "Performance insights for your sites."
Date Range Filters
Toggle the reporting period using the filter buttons at the top:
- Week — Data from the last 7 days. Best for spotting recent changes.
- Month — Data from the last 30 days. Ideal for regular performance reviews.
- Quarter — Data from the last 90 days. Useful for trend analysis and strategic discussions.
Tap a filter to reload the metrics for that time period.
Key Metrics Explained
| Metric | What It Measures | Why It Matters | -------- | ----------------- | ---------------- | Total Patrols | Number of patrol tours completed by guards | Higher counts indicate more thorough site coverage | Total Incidents | Number of security incidents reported | Tracks the frequency of security events at your sites | Avg Response Time | Average time guards take to respond to alerts | Shorter response times mean faster reaction to security events | Coverage Rate (%) | Percentage of scheduled guard shifts that were filled | Below 95% may indicate staffing or scheduling issues | Total Reports | Total number of reports filed (incidents + patrols) | Shows overall documentation and reporting activity | Guards On Duty | Average number of guards working during the period | Helps verify you are receiving the contracted coverage |
|---|
How to Use Analytics Effectively
Comparing Time Periods
Switch between Week, Month, and Quarter views to identify trends. For example, if incident counts are rising month over month, it may be time to discuss additional coverage or preventive measures with your provider.
Tracking Patrol Completion
Higher patrol counts generally mean better site coverage. If patrol numbers drop, it could indicate guard availability issues or route changes. Compare patrol counts against your contracted patrol schedule.
Monitoring Response Times
Shorter response times are always better for security events. If average response time is increasing, discuss potential causes with your security provider — it could be related to site layout, staffing levels, or alert routing.
Reviewing Coverage Rate
A coverage rate below 95% suggests that some scheduled shifts are not being filled. This is an important metric to bring up in service review meetings. Consistently high coverage rates (above 98%) indicate reliable staffing.
Tips
- Review analytics monthly as part of your regular performance discussions with your security provider.
- Share metrics with stakeholders to demonstrate security ROI and justify your security budget.
- Focus on trends over time rather than individual data points — a single bad week does not necessarily indicate a systemic problem.
- Compare your analytics with site reports for a complete picture — numbers tell you what happened, reports tell you why.
- Set benchmarks — Establish target values for key metrics (e.g., 98% coverage, average response under 5 minutes) and track progress over time.
- Export or screenshot key metrics for inclusion in board reports or compliance documentation.
Related Articles
- Viewing Site Reports
- Guard Ratings & Preferences
- Getting Started with the Client Portal
- Viewing the Guard Schedule
- Viewing Your Sites