


Site Comparison Reports
Attlock's site comparison feature lets you evaluate performance across multiple sites side by side. By comparing patrol compliance, incident counts, response times, and other metrics, you can identify which sites are performing well and which need attention.
Accessing Site Comparison Reports
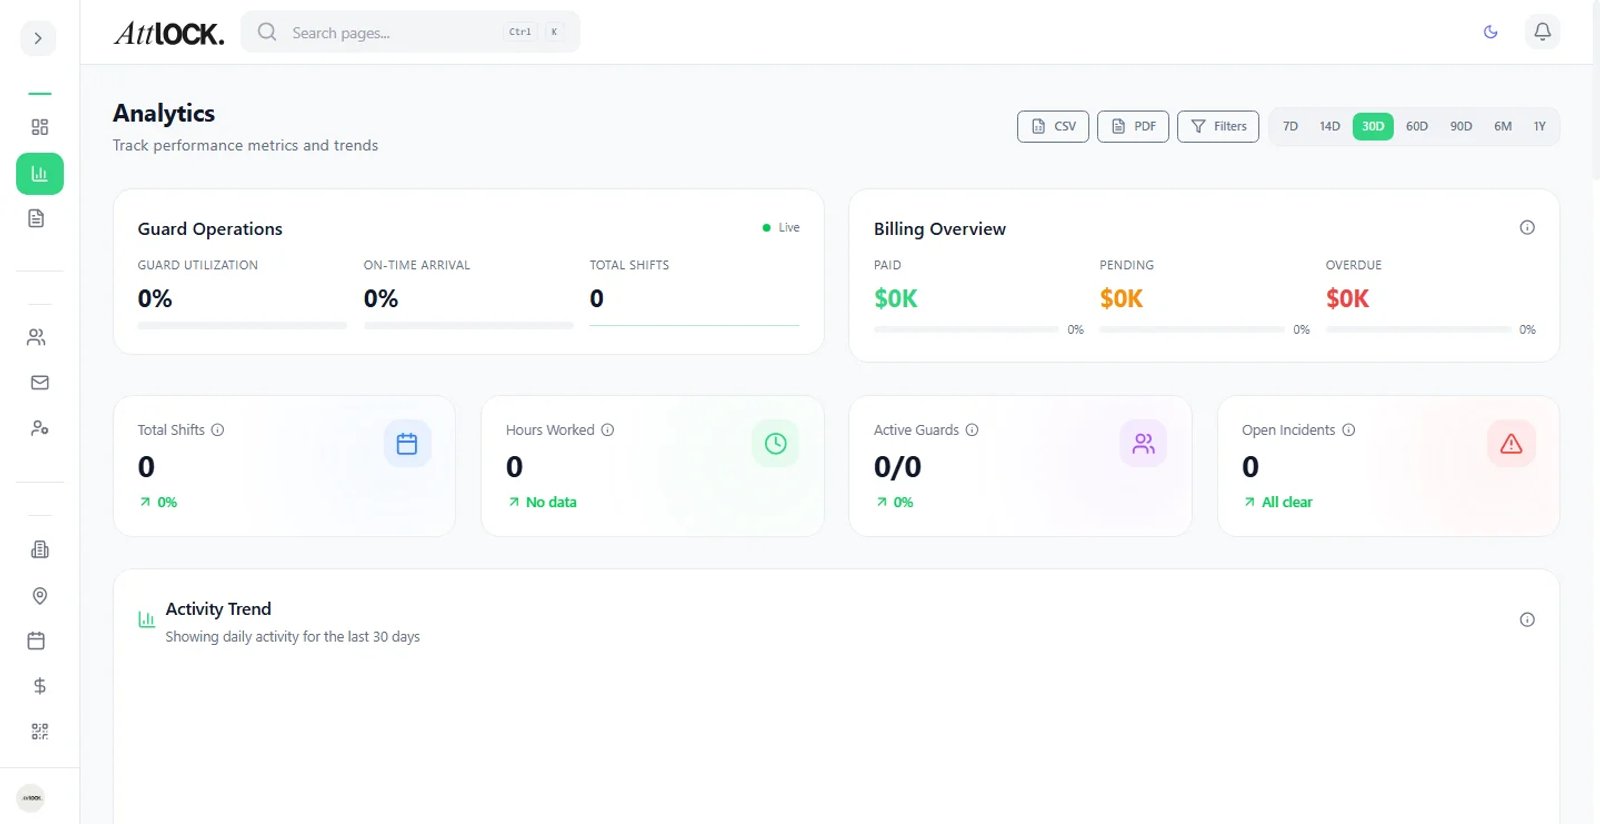
- Open the admin sidebar and navigate to Reports
- Click the Comparison tab at the top of the Reports page
- The site comparison dashboard loads with your default metrics
Setting Up a Comparison
Selecting Sites
- Click the Select Sites dropdown at the top of the page
- Check the boxes next to the sites you want to compare (select two or more)
- You can select up to 10 sites for a single comparison
- Click Apply to load the comparison data
Choosing a Date Range
- Use the Date Range picker to set the period you want to analyze
- Common presets include: Last 7 Days, Last 30 Days, Last Quarter, and Custom
- The comparison updates automatically when you change the date range
Metrics You Can Compare
Patrol Compliance
- Completion Rate — Percentage of scheduled patrols completed on time
- Missed Patrols — Number of patrols that were not completed
- Late Patrols — Patrols completed but outside the scheduled window
- Average Patrol Duration — How long patrols typically take at each site
Incident Metrics
- Total Incidents — Number of incidents reported at each site
- Incident Types — Breakdown by category (e.g., trespassing, theft, vandalism, medical)
- Resolution Time — Average time from incident report to resolution
Response Times
- Average Response Time — How quickly guards respond to alerts or incidents
- Fastest Response — The best response time recorded
- Slowest Response — The longest response time recorded
Guard Performance
- Average Guard Rating — Aggregated performance ratings at each site
- Attendance Rate — Percentage of shifts where guards clocked in on time
- Report Submission Rate — How consistently guards submit their required reports
Reading the Comparison Dashboard
The comparison displays data in two formats:
- Table View — Metrics listed in rows with one column per site, making it easy to scan across
- Chart View — Bar or line charts that visualize differences between sites at a glance
Switch between views using the toggle in the top-right corner of the comparison area.
Color coding helps you spot outliers quickly:
- Green — Site is performing above average
- Yellow — Site is performing at an acceptable level
- Red — Site is below the acceptable threshold and may need intervention
Benchmarking
Attlock calculates an overall benchmark based on all your active sites. Each metric shows how individual sites compare to this company-wide average. This makes it easy to see which sites are outperforming and which are lagging behind.
Exporting Comparison Reports
- Click the Export button in the top-right corner of the comparison page
- Choose PDF for a formatted report suitable for presentations or client meetings
- Choose CSV for raw data you can analyze further in a spreadsheet
- The exported report includes all selected sites, metrics, and the date range
Tips
- Run comparisons monthly to track improvement trends over time
- Share PDF exports with clients to demonstrate service quality
- Use comparison data to identify best practices from top-performing sites
- Investigate sites with declining metrics before they become larger issues