


Reports & Analytics
Attlock provides a powerful reporting engine with pre-built dashboards, a custom report builder, and automated scheduling. Track everything from guard performance to financial metrics.
Accessing Reports
Navigate to Reports in the sidebar or press G and search "Reports". The section includes:
- Report Types — manage report categories
- Report Analytics — visual dashboards
- Report Statistics — summary metrics
- Performance Reports — guard/site performance
- Risk Reports — risk assessments
- Scan Reports — patrol and checkpoint data
- Comparison Reports — side-by-side analysis
- Report Builder — custom report creation
- Report Templates — reusable report designs
- Automated Reports — scheduled delivery
Analytics Dashboard
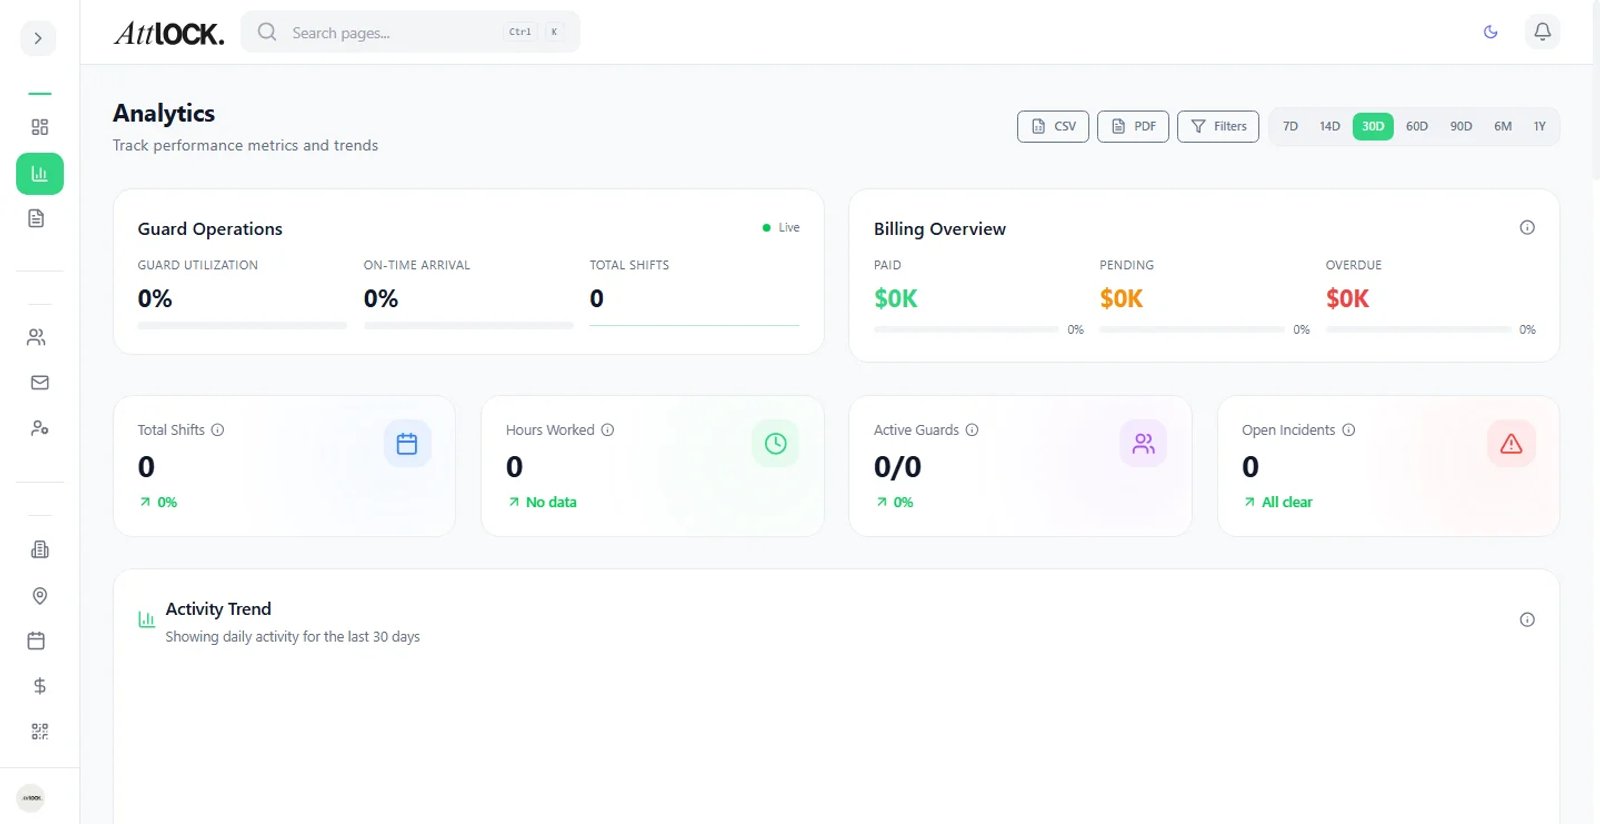
Go to Overview → Analytics for real-time operational metrics:
- Guard productivity charts.
- Incident statistics and trends.
- Shift coverage analysis.
- Performance benchmarks across sites.
- Filter by date range, site, or guard.
Charts include line, bar, pie, and area visualizations.
Report Builder
Create custom reports with any combination of metrics:
Available Metrics (30+)
| Category | Metrics | ---------- | -------- | Shifts | Total Shifts, Completed Shifts, Utilization Rate | Hours | Total Hours, Billable Hours, Overtime Hours, Overtime % | Performance | On-Time Rate, Coverage Rate, Patrol Completion Rate | Financial | Revenue, Cost, Profit, Profit Margin, Cost/Hour | Incidents | Incident Count, Critical Incidents, Resolved Incidents | Response | Avg Response Time, Avg Resolution Time | Patrols | Checkpoint Scans, Patrol Completion Rate |
|---|
Dimensions (Group By)
- By Guard
- By Site
- By Time Period (Day, Week, Month)
- By Report Type
- By Incident Severity
Chart Types
- Bar Chart — grouped or single series.
- Line Chart — multi-metric trend analysis.
- Area Chart — stacked or overlapping areas.
- Pie Chart — metric distribution.
- Table View — data grid with totals row.
Building a Report
- Go to Reports → Report Builder.
- Select your metrics (e.g., Total Hours, Overtime %).
- Choose a dimension (e.g., By Site).
- Pick a chart type.
- Set the date range.
- Click Generate.
- The report renders with color-coded charts, tooltips, and legends.
Formatting
- Percentages for rate metrics.
- Currency ($) for financial metrics.
- Hours/Minutes for time metrics.
- Counts for numeric values.
Report Templates
Save frequently used report configurations:
- Build a report in the Report Builder.
- Click Save as Template.
- Name the template.
- Next time, select the template to auto-fill all settings.
Automated Reports
Schedule reports to generate and deliver automatically:
- Go to Reports → Automated Reports.
- Click Create Automated Report.
- Select a report template or configure from scratch.
- Set the schedule: daily, weekly, or monthly.
- Set recipients (email addresses).
- The system generates and emails the report on schedule.
Report Types
Customize which report types are available to guards:
- Go to Reports → Report Types.
- Create new report types or edit existing ones.
- Define the fields available in each report.
- Enable/disable report types.
- Reorder the list.
Pre-Built Report Categories
Performance Reports
- Guard-level performance scoring.
- On-time rates, patrol completion, incident response.
Risk Reports
- Risk assessments by site.
- Incident severity trends.
- Hot-spot identification.
Scan Reports
- Checkpoint scan data.
- Scan method distribution (QR, NFC, Manual).
- Missed scan analysis.
Comparison Reports
- Side-by-side site comparisons.
- Guard performance rankings.
- Period-over-period trends.
Exporting
- PDF — download any report as a formatted PDF.
- CSV/Excel — export data for external analysis.
- Email — send directly to stakeholders.
Tips
- Set up automated weekly reports for management review.
- Use comparison reports to benchmark sites against each other.
- Check risk reports monthly to proactively address problem areas.
- Share reports with clients via the client portal to build transparency.
Related Articles
- Patrols & Checkpoints
- Payroll Management
- Incidents & Investigations
- Managing Sites